

Mathematician John Venn was born 187 years ago on 4th August! 🎂
A Venn diagram is an illustration that uses circles to show the relationships among things or finite groups of things. Circles that overlap have a commonality while circles that do not overlap do not share those traits. Venn diagrams help to visually represent the similarities and differences between two concepts.
Anybody who has been to high school would know about Venn Diagrams. But I found on Twitter some interesting information about Venn which I thought of posting here.
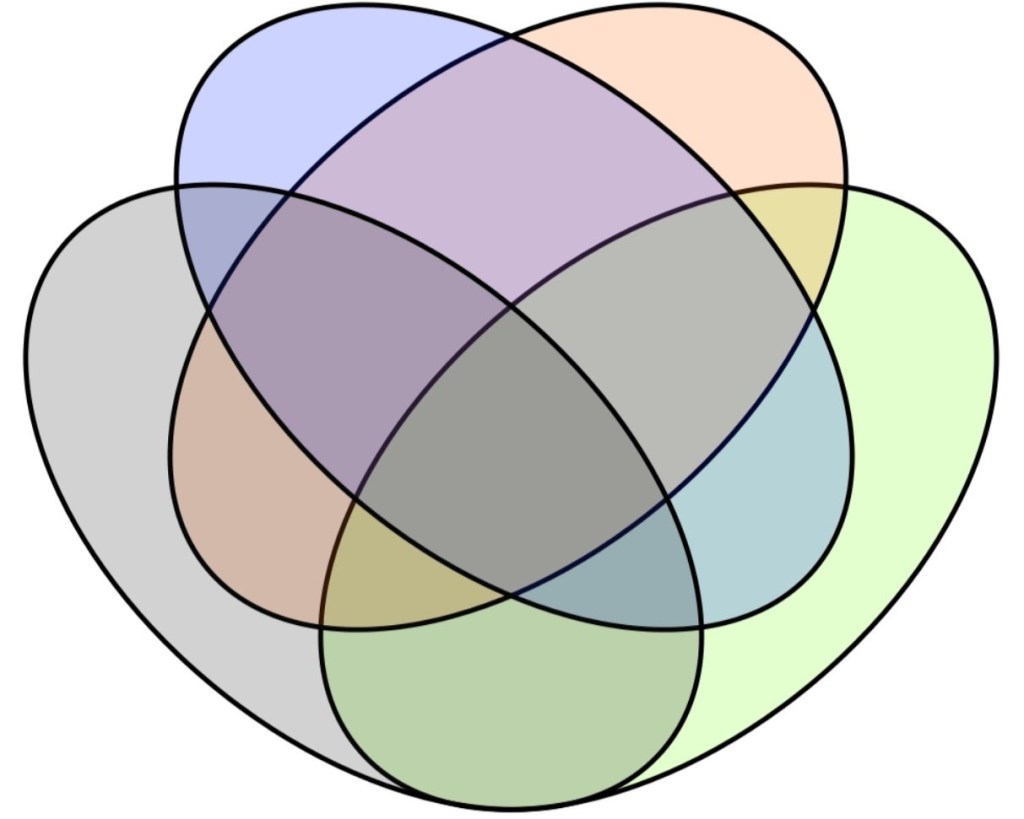
A Venn diagram shows ALL possible relationships between a collection of different sets. So the image below is not a Venn diagram: there are no regions where only yellow and blue meet or only red and green meet.

Here’s a construction John Venn himself came up with that does show all possible relations between four sets

And here’s a symmetric four-set Venn diagram John Venn made using ellipses
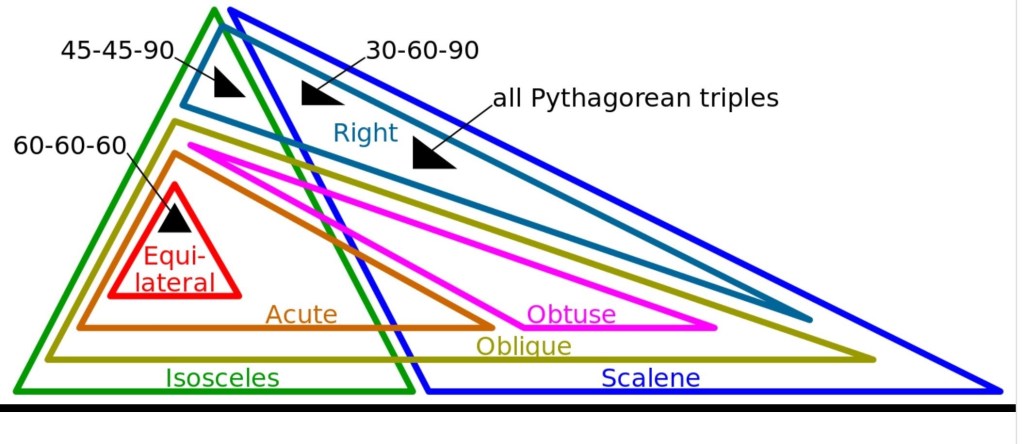
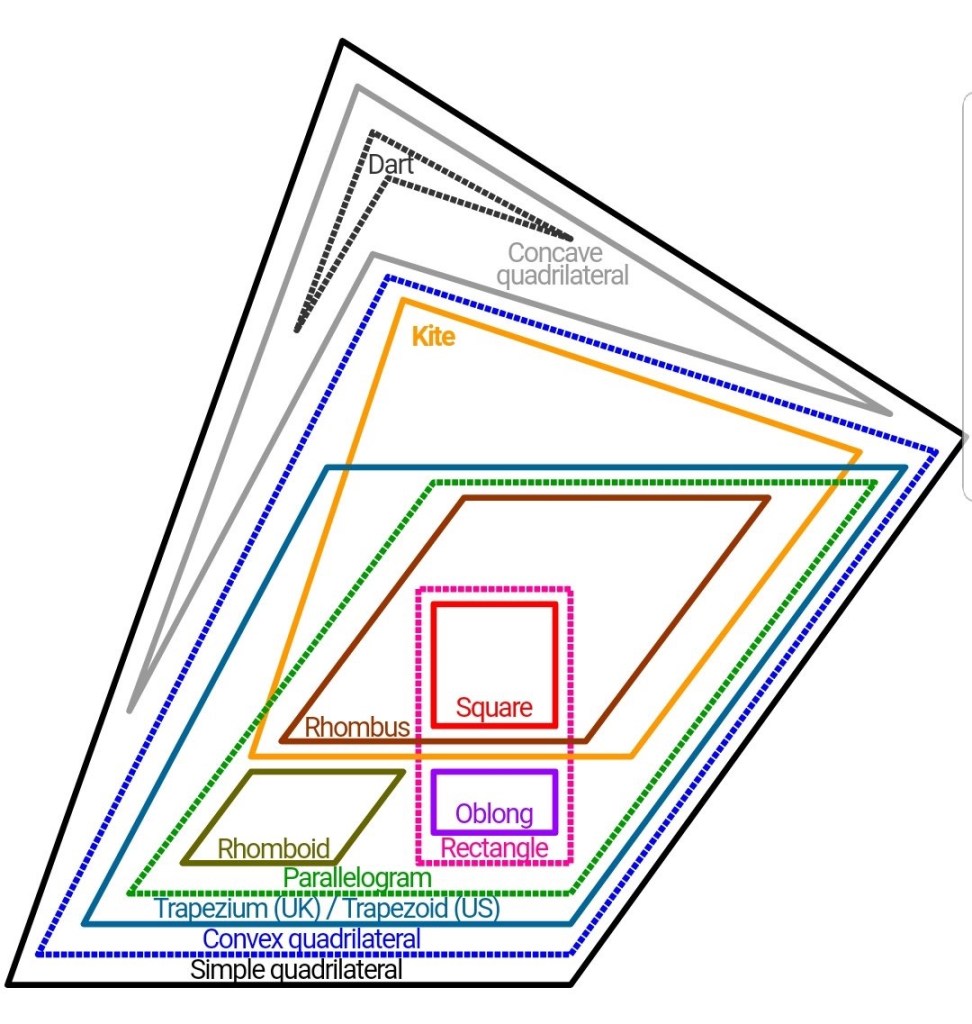
If a diagram merely shows some relationships between sets but not all (perhaps because not all imaginable combinations exist), it’s called an Euler diagram (pronounced “OY-ler”). Here are two showing triangle and quadrilateral types
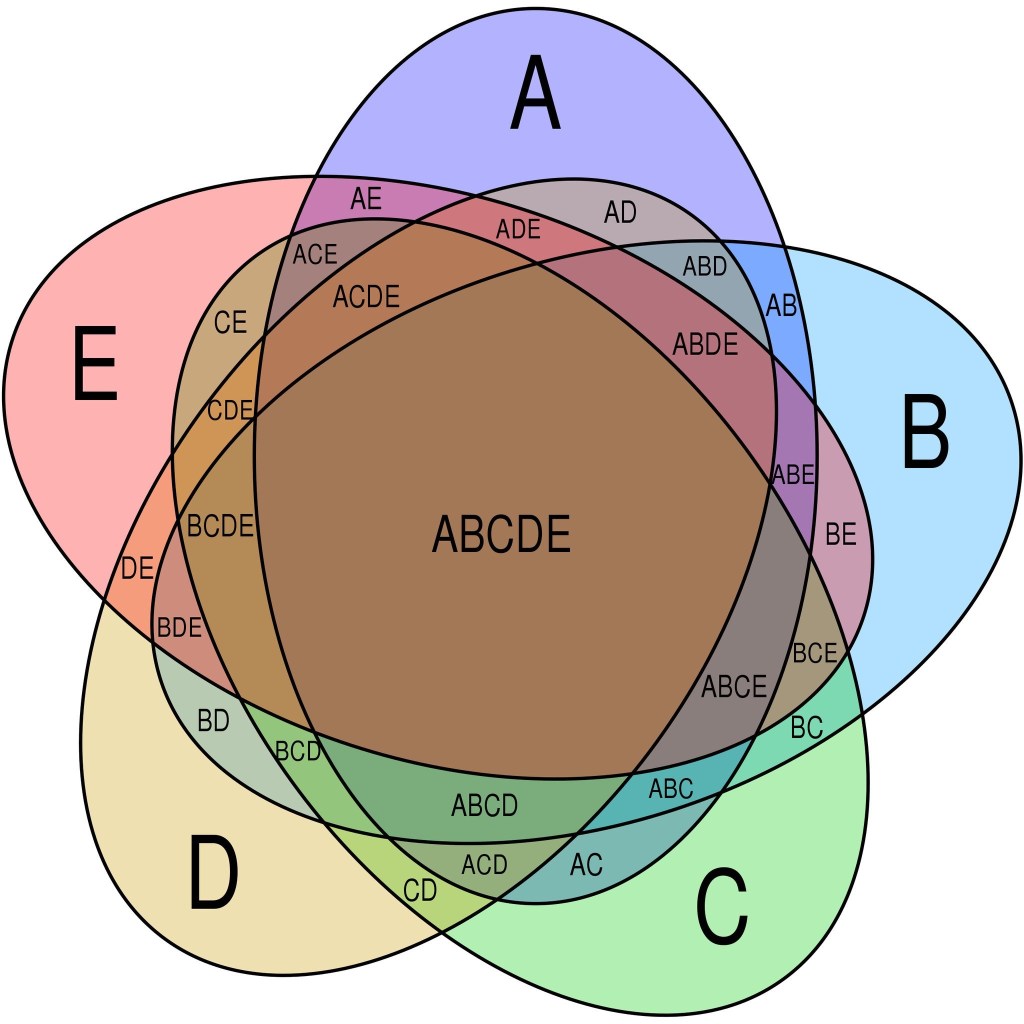
As it turns out, rotationally symmetric Venn diagrams can only be made with a prime number of sets. Here’s one such diagram with 5 sets. It was devised by Branko Grünbaum in 1975.
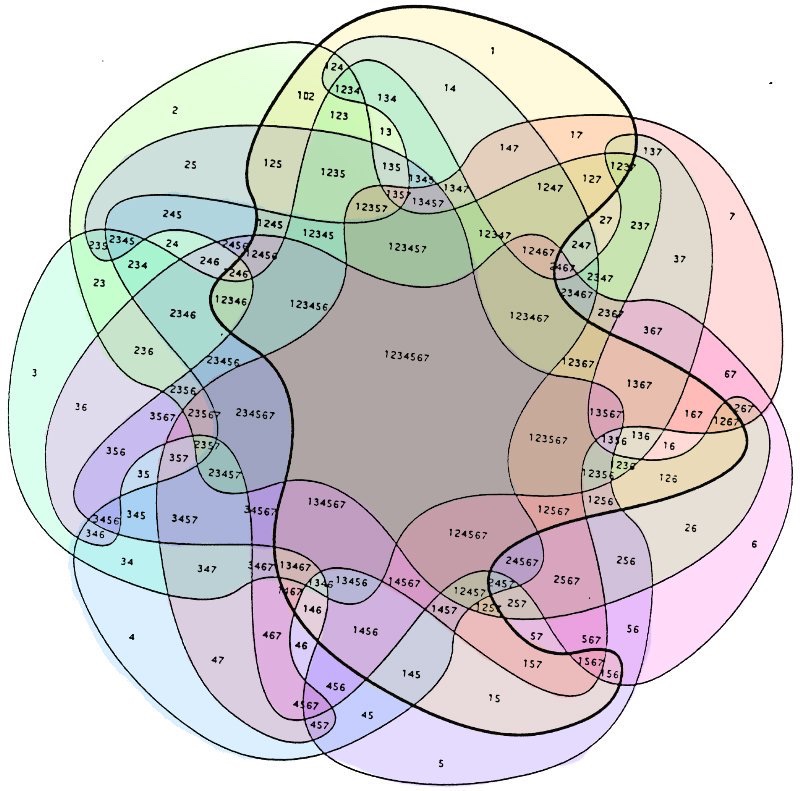
Here’s a cool 7-set that Santiago Ortoz made
Wish if Maths was taught like this in schools!

Leave a comment